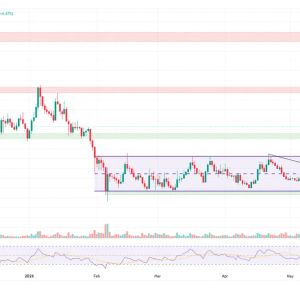
Bitcoin (BTC) regained the $73,000 level on Friday after earlier dipping to $72,500 earlier in the day for the first time since April. While the rebound may look like a quick recovery on the chart, market analyst J.A. Maartun said the bigger story is what the data shows about selling pressure underneath the surface. In his view, this decline is not being driven by price alone, but by coordinated risk-off behavior across futures, spot markets, and exchange-traded funds (ETFs). Futures Sell Hard, Spot Follows According to Maartun, futures traders have been particularly aggressive. He pointed to selling pressure that has reached its strongest level since March, describing a clear imbalance in derivatives activity. One of the key measures he cited was Net Taker Volume at minus $948 million. He also noted that sellers were outpacing buyers by roughly $40 million per hour, a pattern that typically reflects an unwillingness from the market to absorb sell orders and a broader shift toward defense rather than buying. Maartun said the spot market is showing similar weakness, reinforcing the message coming from futures. As part of his comparison, he referenced Coinbase trading at a -0.21% discount versus Binance. In his interpretation, a negative premium like this often signals that US participants are selling more forcefully than counterpart liquidity sources, confirming that the risk-off mood isn’t limited to derivatives desks. He added that this spot softness aligns with ongoing ETF outflows , which have continued to pull capital out of Bitcoin-focused vehicles. Maartun highlighted two consecutive weeks of net outflows, and he said more than $1.0 billion exited from BlackRock’s Bitcoin fund just last week alone. With that institutional demand apparently cooling, he argued the market has fewer buyers ready to step in—creating additional downside pressure even when price briefly snaps back above major levels. Why Bitcoin Bottoming Could Take Time At the same time, Maartun noted that the early data is beginning to hint at something more constructive. He pointed to improving conditions indicated by the stablecoin supply ratio (SSR) indicator, and said Net Taker Volume is nearing historical exhaustion levels. His framing is that extreme selling sometimes marks a turning point, because it drains leverage and forces weaker hands out of the market. On that basis, he suggested the odds of a short-term relief rally are increasing, even if a larger cycle turnaround may take longer. To place expectations in context, Maartun compared how long previous cycle bottoms took to arrive after Bitcoin Halving events . He listed historical timing as 2012, taking 777 days, 2016, taking 889 days, and 2020, taking 925 days. He then compared those benchmarks to the current cycle, estimating it at 768 days—implying that the market may still be in a phase where bottoming processes can unfold slowly rather than in a single instant. Featured image created with OpenArt; chart from TradingView.com